What is a system landscape?
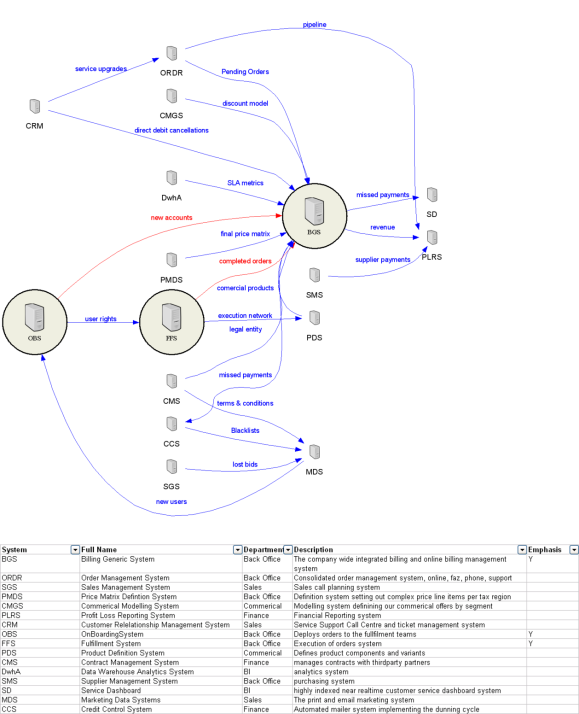
A “system landscape” is a special kind of schematic diagram developed for large enterprises. It’s purpose is to record the dependencies between systems in terms of the transfer and distribution of master data entities. Diagrammatically it’s a simple graph diagram, showing as nodes the logical systems operating in the enterprise, and as edges the interface connections and master entities transfered between them.
It sounds simple, but these are diagrams rarely available in the largest and most complex companies out there.
Below is a made up example generated by me for a generic company. This particular one is very simple, having a small number of nodes and edges. Large companies can expect to have hundreds of source systems connected in god knows how many ways. Blue lines represent existing flows between systems, red lines the proposed ones.
What’s so great about this diagram?
Its simplicity is disarming, but these diagrams radically improved my performance as an architect. That’s because these diagrams are designed to alay the cultural fears and barriers to change that are very real in large and messy enterprises. The fear is that “you can’t change anything, or you’ll break everything.” When I first heard that spoken, it occured to me this was an information problem. Creating a systems landscape diagram addressed this information gap, and helped turn me into a credible agent of change, despite being the new guy. With it, I could respond to these fears in a methodical and rational way. “No, I won’t break everything, just possibly 12 things. So lets engage with those teams now and include them in planning of this change.”
Then later, each time an old timer explained how my proposed changes would break something else downstream I’d not known about, I’d add these new dependencies to the diagram. Because the knowledge was accumulative, soon all the known dependencies were identified after a short time I could move to solving real problems instead of defending myself.
It wasn’t until much later, after I had mapped the entire enterprise in this iterative fashion that I realised the document was extremely useful for radically altering the entire culture of a large company. Everyone wanted a copy of the diagram and it was clear why.
A system landscape diagram demonstrates to everyone that your giant organisation X is “knowable” and more specifically, that you know it. This alone turns your project proposals to change/fix/alter existing architecture from a discussion about what you might break and how crazy your ideas are, into a discussion on how you will negotiate the dependencies on other people and systems succesfully. This is a massive leap in attitude if you’ve ever tried to implement big changes in a big organisation.
Mechanically speaking, these diagrams are easy to generate automatically using graphviz from a spreadsheet – so it is thus easy to keep up to date. This single factor makes these documents “living”. It also means that it is easy to generate collaboratively. Stick the spreadsheet in subversion or in sharepoint, and let everyone contribute to its upkeep.
